Reports & Analytics
The monitoring and reporting section of Arvancloud CDN helps you check and analyze the traffic metrics and DNS requests of your website. This section includes geolocation reporting, traffic analysis, error analysis, status analysis, and DNS requests of your website.
The data that Arvancloud uses for analysis and reporting have the following characteristics:
- All reports analyze the traffic proxied by Arvancloud. (Traffic related to the domain or sub-domain with the cloud symbol on)
Note, it is not possible to present and analyze the DNS report in CNAME setup mode.
-
It is not possible to provide reports for traffic that does not pass through CDN pop sites. If Arvancloud Authoritative DNS is enabled on your domain, but your cloud icon is off, only DNS reports for this domain will be available.
-
Arvancloud uses the IP address of each request to determine the requests or traffic origin country.
Reports are presented in 3-hour, 6-hour, 12-hour, 24-hour, last week, and last month intervals.
In this article, we will review the reports presented in the CDN service panel.
Geographical Location
In this section, Arvancloud determines which countries the requests and traffic are sent from by using the requesters' IP and marks them separately on a map.

Also, in this section, you can check the list of countries that send requests to your website/application based on the number of requests and traffic volume.

Traffic Analysis
This section collects and analyzes the number of users and two types of traffic and requests: cached requests answered from CDN servers and uncached requests received from your website's main server.
This dashboard helps you check the amount of cached content and saved traffic of your website over time. The larger the amount cached by Arvancloud, the fewer requests your server has to respond to and the more free your server resources are.
These criteria are presented in the traffic analysis section by the following responses:
-
Cached: It means that the content of the desired site has been cached in the Arvancloud servers and the user is receiving the cached content from the Arvancloud servers.
-
Missed: It means that the requested content is not cached in the Arvancloud servers and is returned to the user directly from the site's main server.
-
Bypass: It means that the desired content is not cached on Arvancloud's servers in any way, and the request to receive this content is always sent to the website's main server, and the content is displayed to the user from the main server.

In some cases, Arvancloud reports for a domain may not match a report from another source, such as Google Analytics. When the CDN detects a unique IP for a request, the request is considered a hit. Therefore, the number of visitors that Arvancloud displays may be higher than reported by other analytics services.
For example, Google Analytics or other analytics programs use JavaScript in the browser to track visitors. As a result, Google Analytics does not register bots and crawlers because these requests typically do not enable JavaScript. Also, these services do not track visitors who disable JavaScript in their browser or leave a page before it has fully loaded.
Filtering Reports
In order to provide more accurate output, Arvancloud offers the ability to report based on hosts and the desired time period in this report. Using this feature, it is possible to filter the report based on a specific subdomain and a desired time period (up to one year) in this section.
For example, you can check how much traffic you had on a specific subdomain like your user forum in a 5-day period and how much of this traffic and requests were cached.

The ability to filter the report based on the desired subdomain and time frame is available in growth, professional, and enterprise plans.
Error Analysis
In the error analysis section, you can check the number and type of errors in a time chart.

You can also check the type and number of errors you had in the error details section separately for each route and IP address.

This section will help you to notice the disruptions or attacks on your website faster.
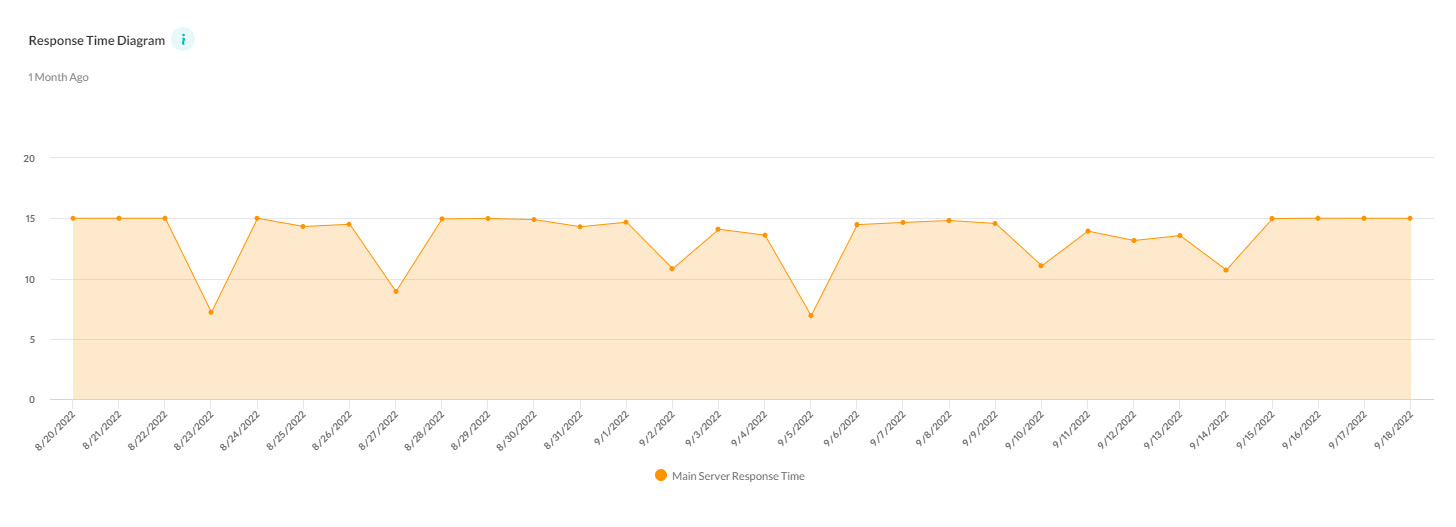
Status Analysis
In this section, you can check the response time of the main server in a time graph.

Also, the status codes can be viewed in a summary form and based on time.

DNS Requests
The number of DNS requests based on time and geographical location is presented in this section.

This report can also be provided for domains that do not use Arvancloud CDN.

